Preventing something is usually easier than taking care of the mess once it happens. This is also true for societies and if a societal crisis or even collapse can be prevented, this would avoid much suffering. However, the tricky thing is that to do this, you would have to know ahead of time that such a negative event is about to take place, which is not a trivial task. However, research over the last decades has looked at tools that might be helpful to determine if a society is on the brink.
Generally, there are two broad scientific camps that look at these kinds of questions, the more statistics focussed approach, mostly championed by climate and especially tipping points researchers and the more structural approach coming from historians.In the following, I will describe both camps and what we can learn from their research to understand how close our own societies might be to a tipping point.
Statistical early warning signs
The main paper that got this line of research started is by Scheffer et al. (2012). The general idea is that a resilient system has processes that help maintain a stable equilibrium. The more connections and redundancies the system has, the longer it can maintain its state against disruptions. The behavior is different for less complex and connected systems, but generally both natural and human systems tend to be of the complex and connected variety and thus we will mostly look at those here. A classic example of this would be global trade (1). Everyone is connected with everyone and if a single company or even a single country ceases trading for a while, the overall system has enough slack and alternative ways to buffer the effects for the most part.
However, once the ability of the system to buffer disruptions reaches its limit, there is a sudden shift to a new state. This is called a critical transition. An example here would be the Amazon rainforest. Currently, the stable state there is rainforest. However, if the climate keeps getting hotter and drier, the region might experience a critical transition to a new Savannah stable state. As trees die due to lack of water, they stop recycling the moisture, which makes the region even drier, which leads to more trees dying, until only shrubs and grasses could survive (2).
A helpful visualization from the paper depicts this as a ball that represents the system and which is rolling around in a landscape of possible states. If there are steep valleys in this landscape, then this is a stable state that is hard to leave. However, over time this can degrade to a new landscape where the peaks around the former valley are eroded and suddenly the ball only needs a little push to transition to a new state (Figure 1).
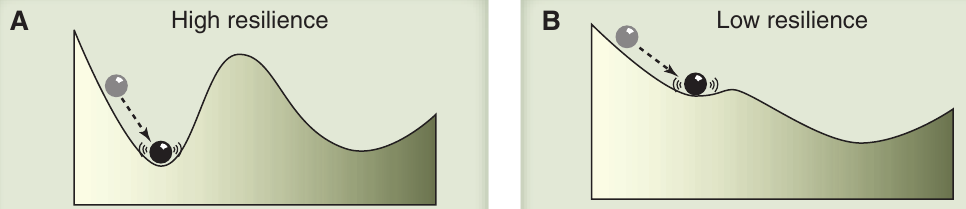
Figure 1: Example of high and low resilience system state landscapes.
The part that makes that paper relevant for the discussion here, is that it finds that in many, very different human and natural systems we can find similar tell-tale signs of a critical transition before it actually happens. The one most often occurring is so called critical slowing down. This is the speed at which the system recovers from small perturbations. The slower it gets in its stability to push itself back to its previous state, the closer the system is to its critical transition and therefore a new state. What this means is that if you find the right proxy for your overall system, you can search for critical slowing down and if you find it, you know that your system is approaching a tipping point. Unfortunately, it does not tell you how close you are though, only that you are getting closer.
Case studies of critical slowing down
The first study we can look at is by Downey et al. (2016). They looked at the population of neolithic humans in Europe to understand how it rose and fell over the millenia. They base this on a massive dataset that covers nine neolithic regions and follows their development over four thousand years. In those populations they look for critical slowing down. They find that there is a critical slowing down in the growth rate of the population before it shifts to a slower growth regime. This means in this case it seems possible to detect when a human population moves into dangerous territory. However, it does not tell anything on why this critical slowing down happened. The authors hypothesize that this might be due to overexploitation of natural resources, disease or violence, but ultimately this part of the paper remains mostly guesswork.
Another case study that presents a bit more modern population is by Scheffer et al. (2021). They looked at pre-Hispanic Pueblo societies. Just like the Downey study, they wanted to understand if there is a way to see early signs of a shift in society happening. The society they looked at has 5 distinct periods, which all start with slow growth and end with the sites being abandoned. As they do not have population numbers, they devise another proxy for how well the society is doing. The houses in the area use wood and for each of the trees used, the time it grew can be determined. This means that it is possible to analyze how many trees were felled at each point in time. The authors argue that this represents a proxy of how well the society is doing, as you generally only build a new house if you have the resources to do so and when you are expecting to live there for a while. Using this approach they get a timeseries of overall building activity and use this to look for critical slowing down as well. They find a critical slowing down before the end of the majority of the settlement periods. As the tree also allows them to reconstruct the climate, they check if the climate might have been the ultimate cause that toppled these settlements, but find that there are plenty of examples of bad climate that did not result in abandoned settlements. Therefore, another process has to be happening here. They find more signs of violence at those times as well, indicating a breakdown of the social fabric. Though, there are also events where settlements were abandoned without any warning signs, indicating that some large, unexpected shocks can also dislodge well established societies.
Political instability as key indicator
The explanations above show that the approach to focus on statistical early warning signs is great if you want to have a rough idea if your society is going in the right or wrong direction, but it has the clear downside that it has a really hard time attributing any societal problems to a clear cause. The method is totally agnostic to what is going on in a society, it just detects irregularities and it also cannot really tell you how close to the brink you actually are. However, if we truly want to understand what is happening and what might be done about it, there is also the need for process understanding and not only analyzing statistical patterns.
The most mature approach to attempt this is structural demographic theory (SDT). A good introductory paper here is Turchin (2012). It explains the broad strokes of SDT and analyzes how well it applies to the whole history of the United States. The origins of SDT are the discovery of so-called secular cycles. These are cycles of political instability which repeat in a somewhat predictable pattern. Political instability here is measured in violent, group-based events, think riots, terrorism or lynchings (Figure 2).
This is worth holding on to, because it sets the limit of what the theory has actually been tested against. SDT has shown a connection between structural pressures and unrest. It has not shown that those pressures predict collapse, and the two are not the same thing. The United States did not fall apart in 1870 or 1920, it had a very bad time.
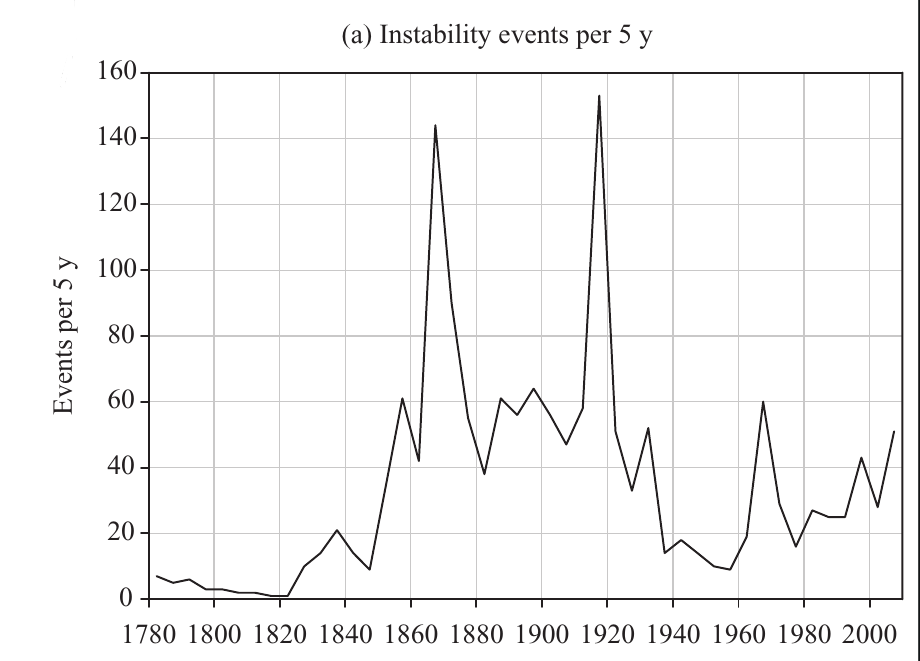
Figure 2: Instability events in the United States
When this curve is split into the underlying patterns it becomes clear that this consists of a longer 150 year cycle and a shorter 50 year cycle, superimposed on the longer one. The highest peaks are reached when both the 150 year cycle and the 50 year cycle are at their peaks, which happened around 1870 and 1920. Both were times of massive turmoil in the United States. Similar patterns can be found in many other societies and SDT is the attempt to explain how these patterns arise.
The general idea of SDT is that when population growth is higher than the rise of productivity, this starts a cascade that leads to political unrest. First it leads to a decline in real wages and pushes inflation. This leads to popular immiseration. Also, when there is a lot of population growth, a youth bulge develops, meaning a lot more young people in comparison to the older cohorts. Both factors lead to problems, as it means many people are struggling to accumulate the necessities of life. The second part of SDT is that it leads to elite overproduction. Elites can accumulate more of the societal wealth when real wages fall, as they are in a better bargaining position. This means more elites, which also have more resources to funnel into status competition. That too destabilizes society. Finally, as the elites funnel ever more resources to themselves and the state has to spend more and more money to maintain infrastructure for the rising population, the coffers empty, as the entrenched elites and the working poor are both against higher taxation. Taken all together, this means the state can do less, while the general population struggles and the elites spend all their time competing with each other. This destabilizes states and can lead to collapse, but does not necessarily have to.
To further validate the theory, Turchin also checks if all those markers tend to trend in the same direction as political instability and it turns out they produce a very, very similar pattern (Figure 3). Turchin also used this framework in 2010 to forecast rising instability in the United States around 2020, and anti-government demonstrations and riots did increase sharply over that decade, so the direction was right.
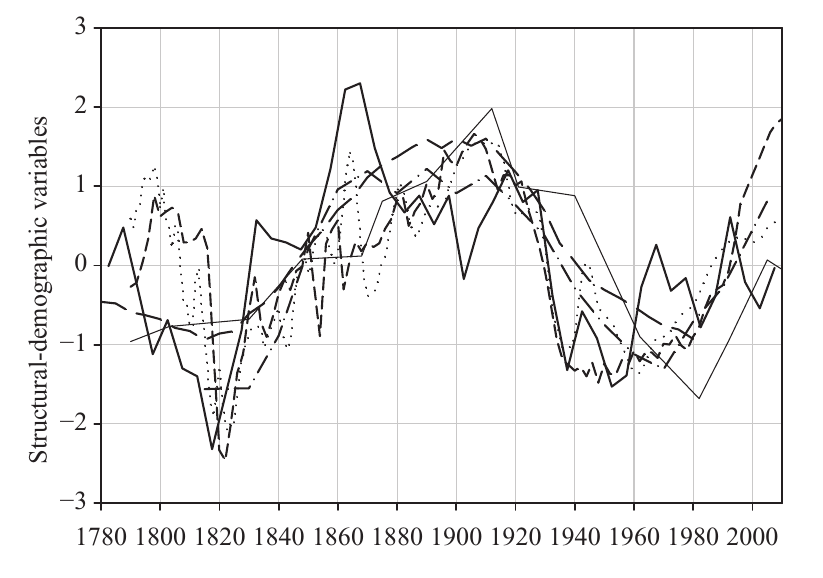
Figure 3: Instability (thick solid line), immigration (dash-dot line), the inverse wage/GDP ratio (dotted line), inverse health (long-dash line), inequality (thin solid line), and polarization (short-dash line). All variables have been linearly detrended and scaled to the same mean and variance.
Case studies for structural demographic theory
To validate the ideas of structural demographic theory, Turchin has assembled a larger team that spent the last decades collecting vast historical datasets. The most recent of these datasets is CrisisDB, which has been used in Hoyer et al. (2023, 2025) to look for societies that experienced major crises. Hoyer et al. (2023) combines the ideas of structural demographic theory with the idea of the current polycrises we are living through (Figure 4). The idea is to show that human societies are experiencing pressure from the outside that can be both environmental or from other societies. Based on their structural conditions, they experience more or less social pressure and disunity, which ultimately leads to crisis. Though this does not automatically mean a bad outcome. Depending on the choices the society makes, this can also lead to renewal and adaptation. Though in both cases the choices the society makes influence its environment and other societies, which closes the cycle.
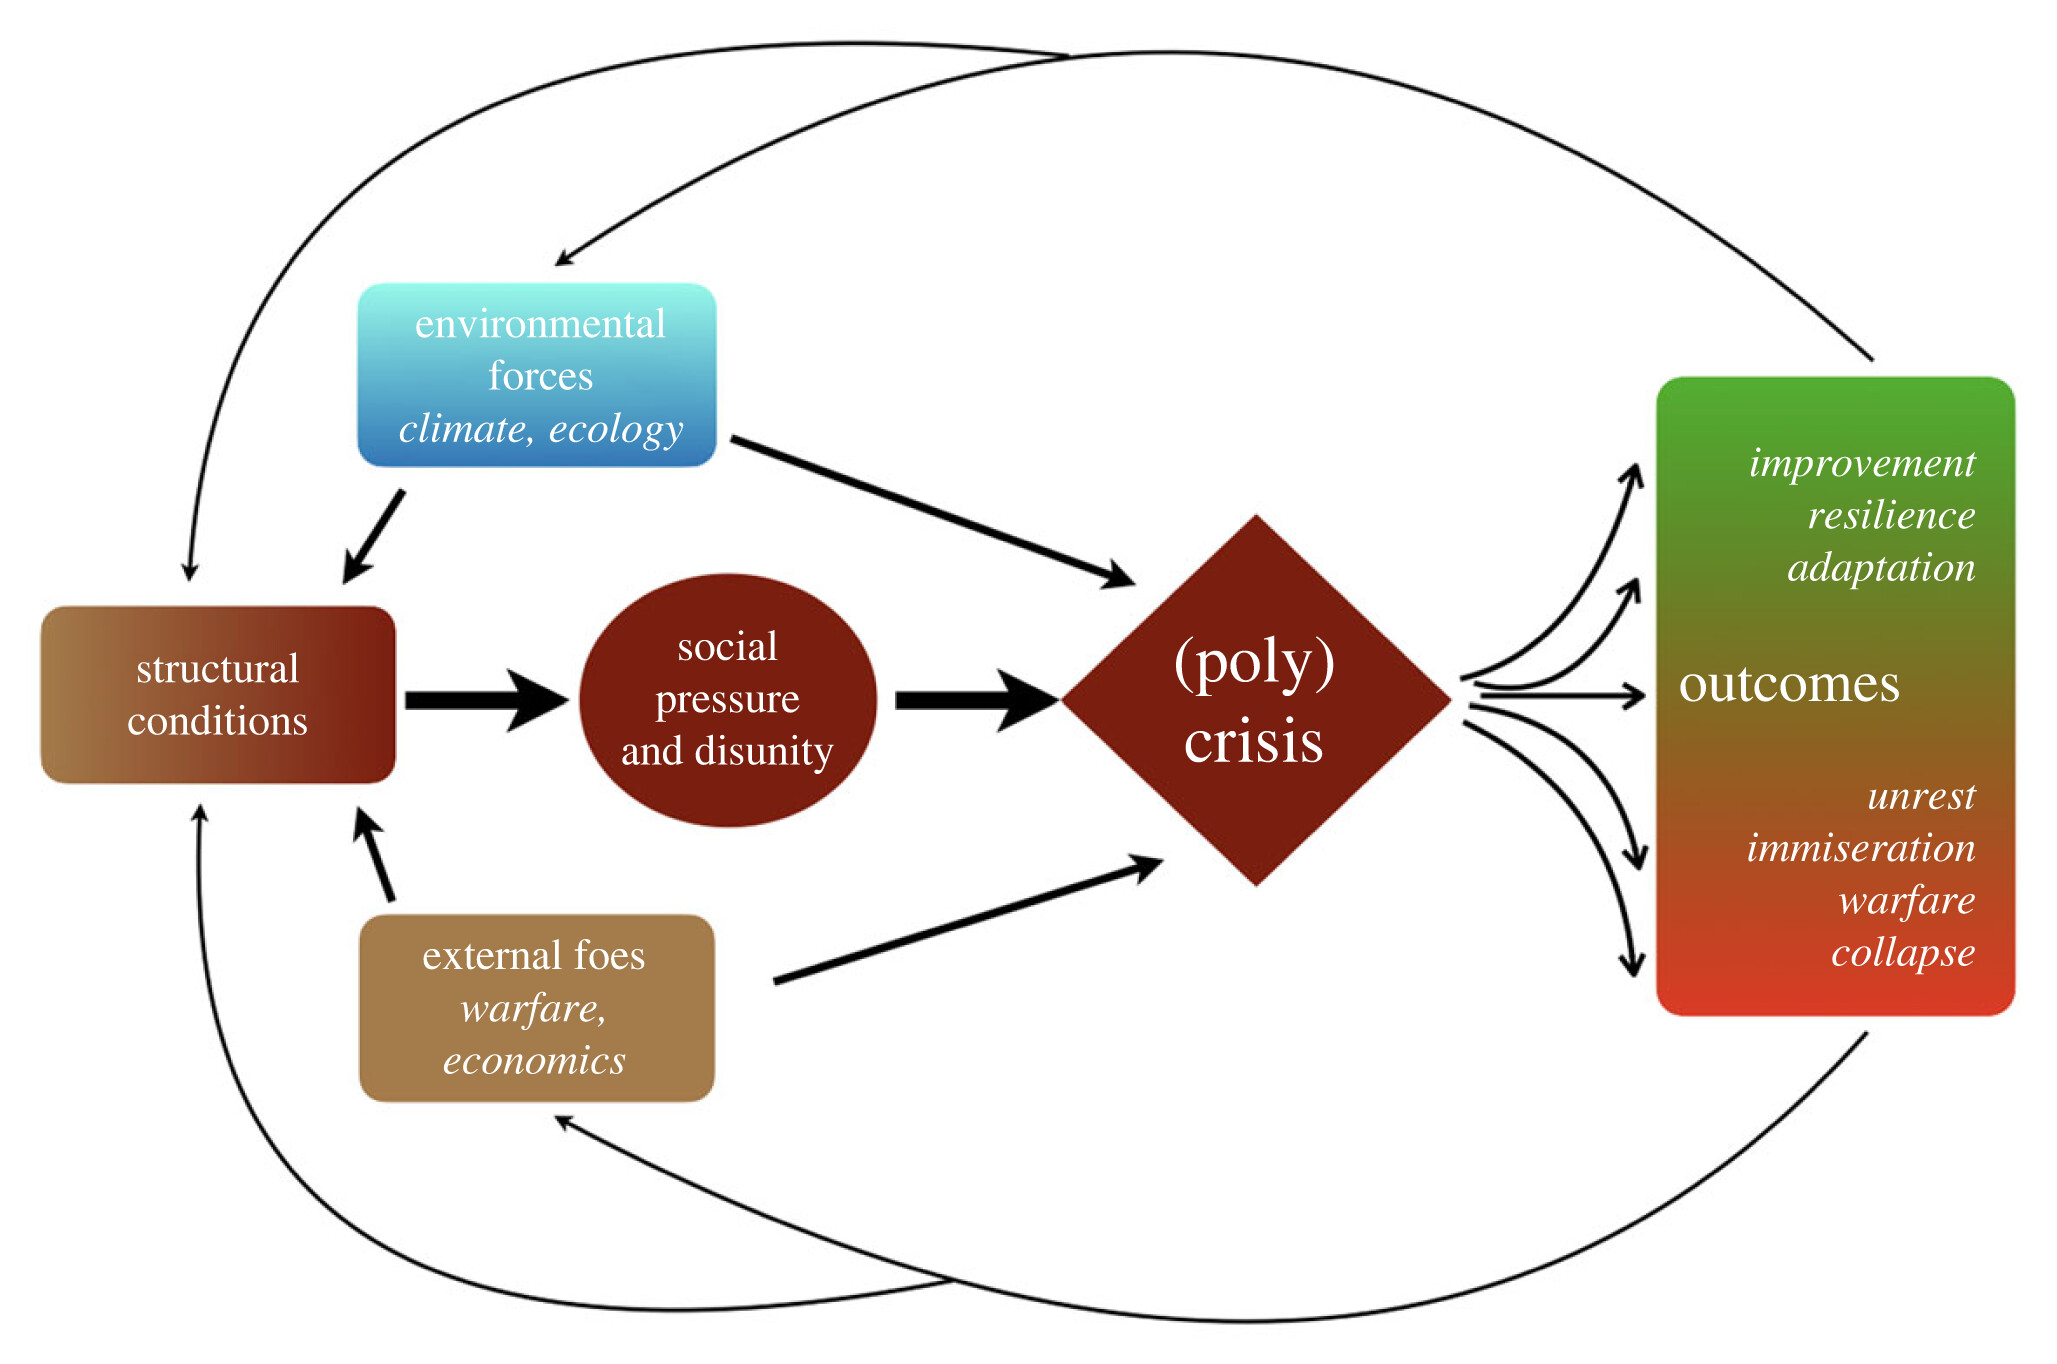
Figure 4: Flowchart illustrating idealized causal connections between society and environment.
To illustrate this process Hoyer et al. highlights case studies from their database. The first one is the Qing Dynasty which ruled China from 1644 till 1911. Early in their reign they faced the Little Ice Age, but were able to navigate this climatological threat. They even implemented state-run granaries that distributed food in difficult times. However, in the second half of their reign, they experienced massive population growth and declining productivity, which started the mechanisms of structural demographic theory: popular immiseration, elite overproduction and deteriorating state finances. This led to the Taiping Rebellion, the bloodiest civil war in history. At the same time the state infrastructure deteriorated. When a harsher climate occurred later the population had to go hungry. Finally, European power started to intervene in Chinese affairs. All these factors in combination led to the demise of the Qing dynasty.
The second one is the Ottoman Empire. Here the outside factors were even stronger, with the empires experiencing an unprecedented drought in the 1590s. In parallel internal unrest peaked from 1520 to 1610. This led to famine and diseases, killing a significant fraction of the population. However, this also relieved pressure and productivity could rise again. Also, in contrast to the Qing, the Ottomans kept on maintaining their public infrastructure like irrigation. Allowing the empire to stabilize and make it through these difficult times without collapsing.
Hoyer et al. (2025) does something even more ambitious, by looking at countries that were able to avoid big crises, to understand what the important factors are for this. To do so, they looked in their timeseries of political instability for times where there were lots of instability events, but no major crises occurred. They then looked into those case studies to understand how they were able to avoid crises. The four best case studies they found were the conflict of the orders in the early Roman republic, the Chartist period in England, the 19th century reform period in Russia and the progressive era in the United States. What these cases have in common is that even major societal instabilities can be rectified if the reform is big enough. This is easier for societies that have lots of resources, like all the case studies were from empires that were able to absorb resources from the territories they had conquered. Though this is not a prerequisite for reform, it just makes it easier. The reforms that were implemented in all of these cases had two main aims: giving more people the ability to participate and reducing inequality. This means the society either has to get buy-in from or force the elites to give up some of their spoils and influence. But if this is accomplished, the society can look for much more prosperous times ahead.
The design of the study does limit what it can tell us though. The cases were picked because they are instances where instability was high and no crisis followed, and the helpful reforms were then identified by looking at what those societies did. That is a good way to generate hypotheses about what helps. It cannot tell you whether the reforms were what made the difference, because there is no comparison with the societies that reformed and still failed.
How much can these warning signs tell us?
Both approaches are much better at explaining the past than at telling you where you are right now. The first problem is base rates. Unrest is common and collapse is rare. Almost every society in the historical record has periods of riots, coups and political violence, and only a small fraction of those periods end in anything that deserves to be called collapse. An indicator that reliably fires before collapse will therefore also fire many times when nothing much follows, and this stays true even if the indicator is picking up real pressure. The second problem is that the analyst almost always knows the answer already. The studies above are choosing the proxy, the detrending and the window length with the advantage of hindsight. Forecasting in the future is a different job. The third problem is that the assumptions behind critical slowing down assume a system with a fixed structure. Societies do not sit still like that. They change their own institutions and technology changes what counts as a shock. This also could produce rising variance and rising autocorrelation with no tipping point anywhere nearby. Finally, societies are reflexive in a way that rainforests are not. If a warning system worked well enough to be believed, people would act on it and change the thing being measured. That is the whole point of building one, but it also means it can never be validated the way a climate tipping point indicator can, because there is one run of history and no control.
Bringing this all together
All this means there are two main approaches that try to predict how close a society is to major crisis or even collapse. In combination they could be pretty potent in predicting which societies will have to reform soon to avoid catastrophe, but you can never really be sure if they are really warning you of collapse.
Structural demographic theory tells you which societal markers to look out for: rapid population growth, growing economic inequality, popular immiseration, runaway growth of the top incomes and elite overproduction. If all of these are getting worse, more troublesome times have a good chance of being ahead. However, it does not really tell you if you are already in dangerous territory. This is where the statistical early warning signs could be quite helpful. They could be used to analyze those societies that experience worsening structural demographic markers in more detail. In those societies you would have to find additional markers of societal well being and growth and see if they show signs of critical slowing down. A simple example could be GDP, but there are likely much better markers out there. If those show signs of critical slowing down, while the society also experiences worsening structural demographic markers, you should really take a closer look at what is going on to make sure that no big crisis occurs.
It does not seem like anybody has done the study yet to check for these things on a global level in a systematic way that would satisfy checking for both of these theories. Creating this could be a quite impactful future research avenue.
However, what these things also show, that you can also just be unlucky and be one of those societies that get felled by a big, cataclysmic event, even though you were well prepared for regular disasters.
Endnotes
(1) See here for more information about the global trade system.
(2) There’s a great study by Nico Wunderling that describes this shift in more detail.
References
- Downey, S., Haas, R., & Shennan, S. (2016). European Neolithic societies showed early warning signals of population collapse. Proceedings of the National Academy of Sciences, 113, 9751–9756. https://doi.org/10.1073/pnas.1602504113
- Hoyer, D., Bennett, J. S., Reddish, J., Holder, S., Howard, R., Benam, M., Levine, J., Ludlow, F., Feinman, G., & Turchin, P. (2023). Navigating polycrisis: Long-run socio-cultural factors shape response to changing climate. Philosophical Transactions of the Royal Society B: Biological Sciences, 378(1889), 20220402. https://doi.org/10.1098/rstb.2022.0402
- Hoyer, D., Bennett, J. S., Whitehouse, H., Francois, P., Reddish, J., Davis, D., Feeney, K. C., Levine, J., Holder, S. L., & Turchin, P. (2025). CRISES AVERTED. How A Few Past Societies Found Adaptive Reforms in the Face of Structural-Demographic Crises. Cliodynamics: The Journal of Quantitative History and Cultural Evolution, 16(1). https://doi.org/10.21237/C7CLIO.38365
- Scheffer, M., Carpenter, S. R., Lenton, T. M., Bascompte, J., Brock, W., Dakos, V., van de Koppel, J., van de Leemput, I. A., Levin, S. A., van Nes, E. H., Pascual, M., & Vandermeer, J. (2012). Anticipating Critical Transitions. Science, 338(6105), 344–348. https://doi.org/10.1126/science.1225244
- Scheffer, M., van Nes, E. H., Bird, D., Bocinsky, R. K., & Kohler, T. A. (2021). Loss of resilience preceded transformations of pre-Hispanic Pueblo societies. Proceedings of the National Academy of Sciences, 118(18), e2024397118. https://doi.org/10.1073/pnas.2024397118
- Turchin, P. (2012). Dynamics of political instability in the United States, 1780–2010. Journal of Peace Research, 49(4), 577–591. https://doi.org/10.1177/0022343312442078