Many articles highlight famine as a major issue for societal collapse, emphasizing the overall vulnerability of food production and trade. The speed at which such events affect us depends on our food reserves. But how much food do we really have in stock?
Global food stocks by season
It’s surprisingly difficult to find reliable data on global food reserves. While pop science articles sometimes make bold claims, there is little rigorous research on this topic. The few papers that exist often focus on wheat, using it as a proxy for overall food stocks since it is our most important crop. For instance, Do et al. (2010) looked at global wheat supply over a five-year period (2004-2008) and found that grain stocks typically cover about 2 to 6.6 months of wheat consumption, depending heavily on the time of year (Figure 1) (1).
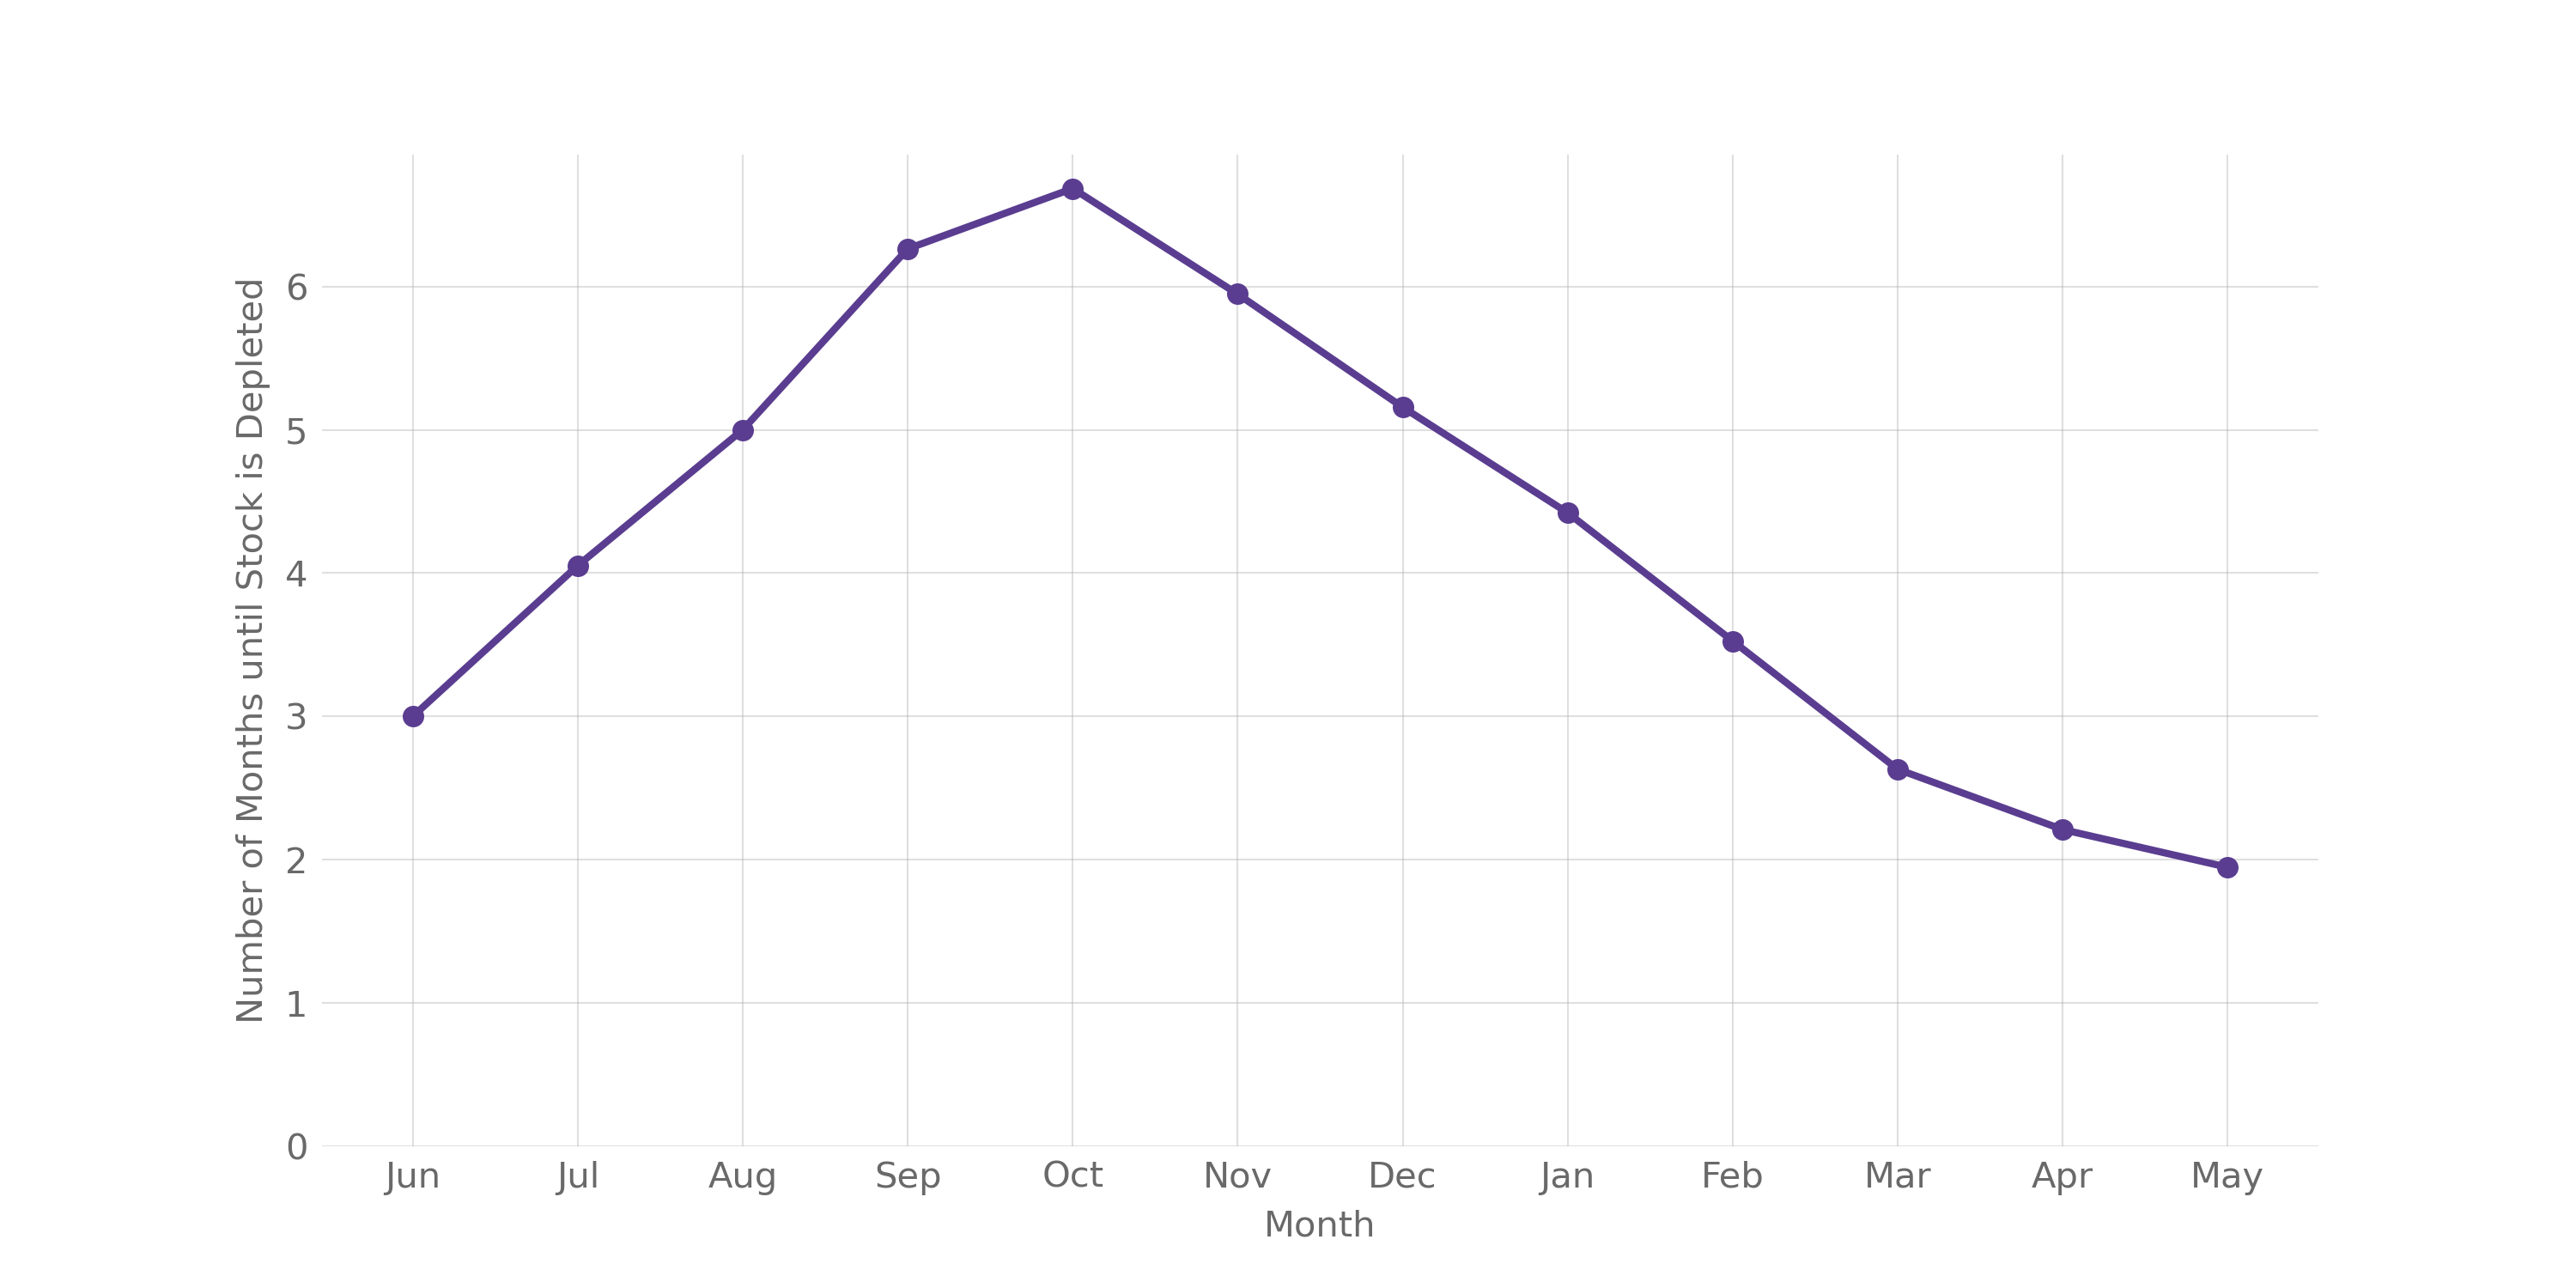
Figure 1: Number of months until global wheat stock is depleted using monthly consumption. Based on Do et al. (2010).
Wheat stocks typically peak in October and hit their lowest point in May, due to the geographic distribution of global wheat-growing regions. The main wheat-producing areas—such as the United States, China, India, Central Europe, and Russia—harvest primarily in late summer and autumn in the northern hemisphere, while the main wheat producer in the southern Hemisphere, Australia, harvests a few months later. This seasonal pattern likely applies to food production in general, as the northern hemisphere has significantly more arable land.
Based on Do et al.’s data and further calculations on global food production and storage, Denkenberger & Pearce, 2015 estimate that, in addition to grain stocks, there is an extra 4 months’ supply from other sources like household and store food, wild animals, and draft animals. Even under optimal conditions, this suggests we only have about 11 months’ worth of food globally. These figures likely vary by country, as some nations maintain larger food reserves or are major food exporters, which could be redirected for domestic use.
How have stocks developed over time and world region?
Laio et al. (2016) look at how overall food stocks developed over the last several decades, for all major world regions (Figure 2).
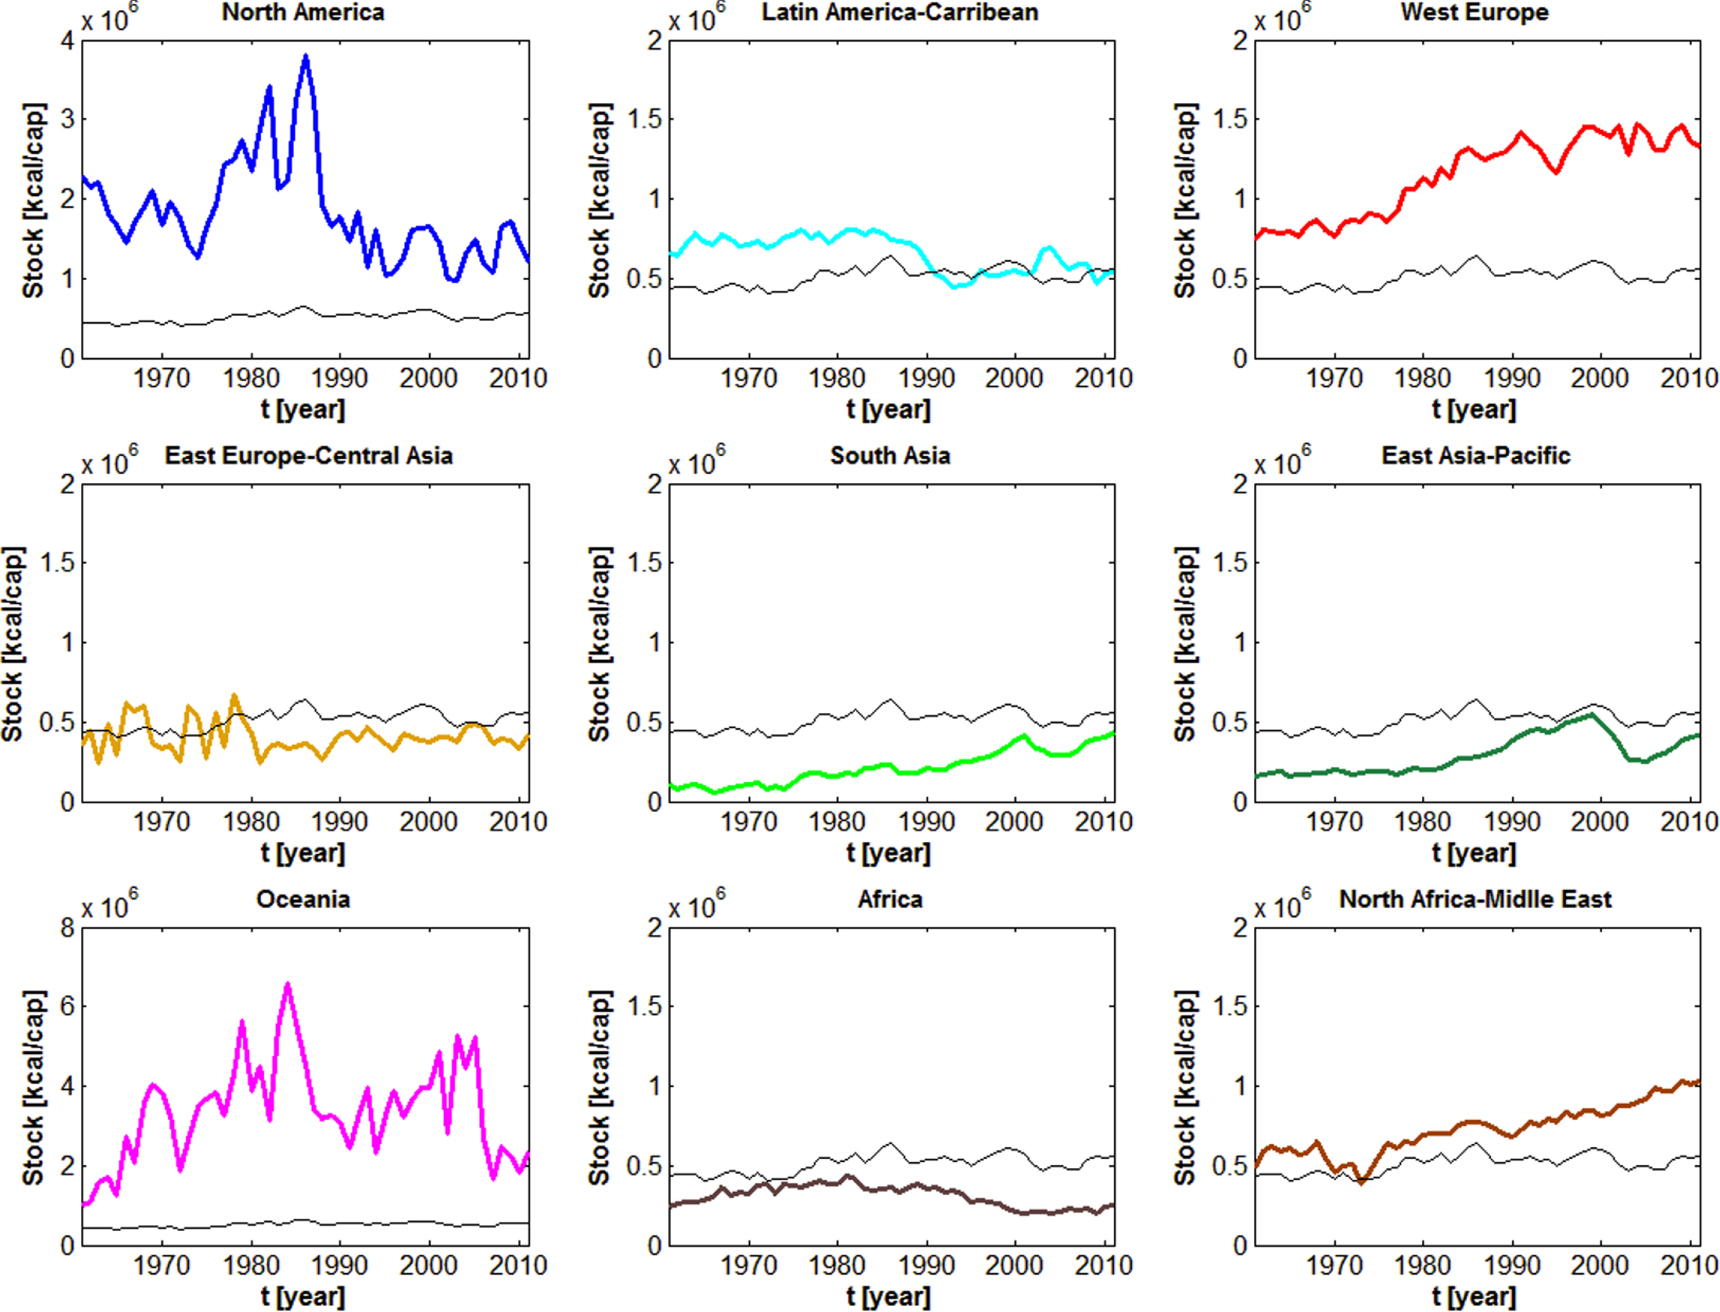
Figure 2: Time series of the (per capita) stocks in the different geographic areas. In each panel, the thin line refers to the behavior of the global stock (per capita). (Laio et al., 2016).
Their findings reveal significant regional differences in food stock levels across the world. For instance, their data indicates that Africa has around 4 months of food stocks, while Oceania has about 32 months (which would further emphasize the resilience of this region). This aligns with food production patterns: regions that produce more food tend to have larger reserves (2).
Laio et al. also examined global food stock availability (the thin line in Figure 2), estimating around 8 months’ worth, which is similar to Denkenberger and Pearce’s estimate. Denkenberger and Pearce’s result is slightly more optimistic as they consider additional sources like warehouses, stores, and wild animals, whereas Laio et al. rely solely on FAO food production data.
Despite regional variation, global food stocks have remained relatively stable over the past 50 years. Laio and colleagues also observed that food stocks across different countries have become more uniform over time. However, data of the last ~15 years is lacking, and it’s unclear if these trends persist, especially after disruptions like COVID-19 and the invasion of Ukraine, which altered trade and crop production patterns. Still, given the long-term stability, it is likely that stock levels remain similar to those of previous decades.
How does food trade supplement food stocks?
As we have discussed in another post, trade is vitally important for our food system. Marchand et al. (2016) study how trade and stocks interact to determine when a region’s food runs out.They created an economic model that looks at how production shocks ripple through a network of food producing and trading countries. The assumption here is that when countries are hit by a production shock, they first use their reserves, then decrease domestic consumption and if those two steps were not enough, reduce exports and increase imports (3).
They find that increased food stocks have played a significant role mitigating the impact of shocks. They found that the food trade network in 2009 was better equipped to absorb shocks compared to earlier years, mainly due to a more strategic distribution of reserves rather than increased trade. Major exporters are highly exposed to food shocks but have large stocks to mitigate the impact. The study highlighted that vulnerabilities tend to occur at a regional level, with clusters in the Americas, South Asia, and East Asia being particularly at risk.
Their conclusions emphasized that the distribution of reserves is more critical than their overall quantity when it comes to resilience against shocks. This likely also explains the somewhat contradictory results by Laio et al. While the global food stocks stayed mostly stable, their distribution shifted and they especially increased in the most vulnerable regions, making the overall system more stable. But still, Marchand and coauthors find that certain regions are more vulnerable to food shortages, and countries at risk of external shocks often form regional clusters. They suggest diversifying staple food supplies and ensuring trading partners have adequate reserves as potential strategies to mitigate food shortages.
Other factors that influence the effects of food stocks
In addition to the total amount of food stored and traded in a region, it’s crucial to consider how much of that food actually reaches consumers. Stocks are useless if there is no access to them. This point was underscored by Jagtap et al. (2022) in a study of the impact of the Russian invasion of Ukraine on the country’s food system. Their expert survey revealed that despite Ukraine having wheat stocks equal to 114% of its annual demand, food access was severely hampered due to the risks of moving goods and ongoing Russian attacks. This was particularly problematic for cattle farmers, who were forced to slaughter animals due to feed shortages. Similar issues could arise in cases of societal collapse, where centralized food storage and unreliable transportation would make accessing food difficult for many.
Another critical factor affecting the use of food stocks is food waste. Alexander et al. (2017) looked at the global food system and how much on each step going from cropland to consumer is wasted (Figure 3).
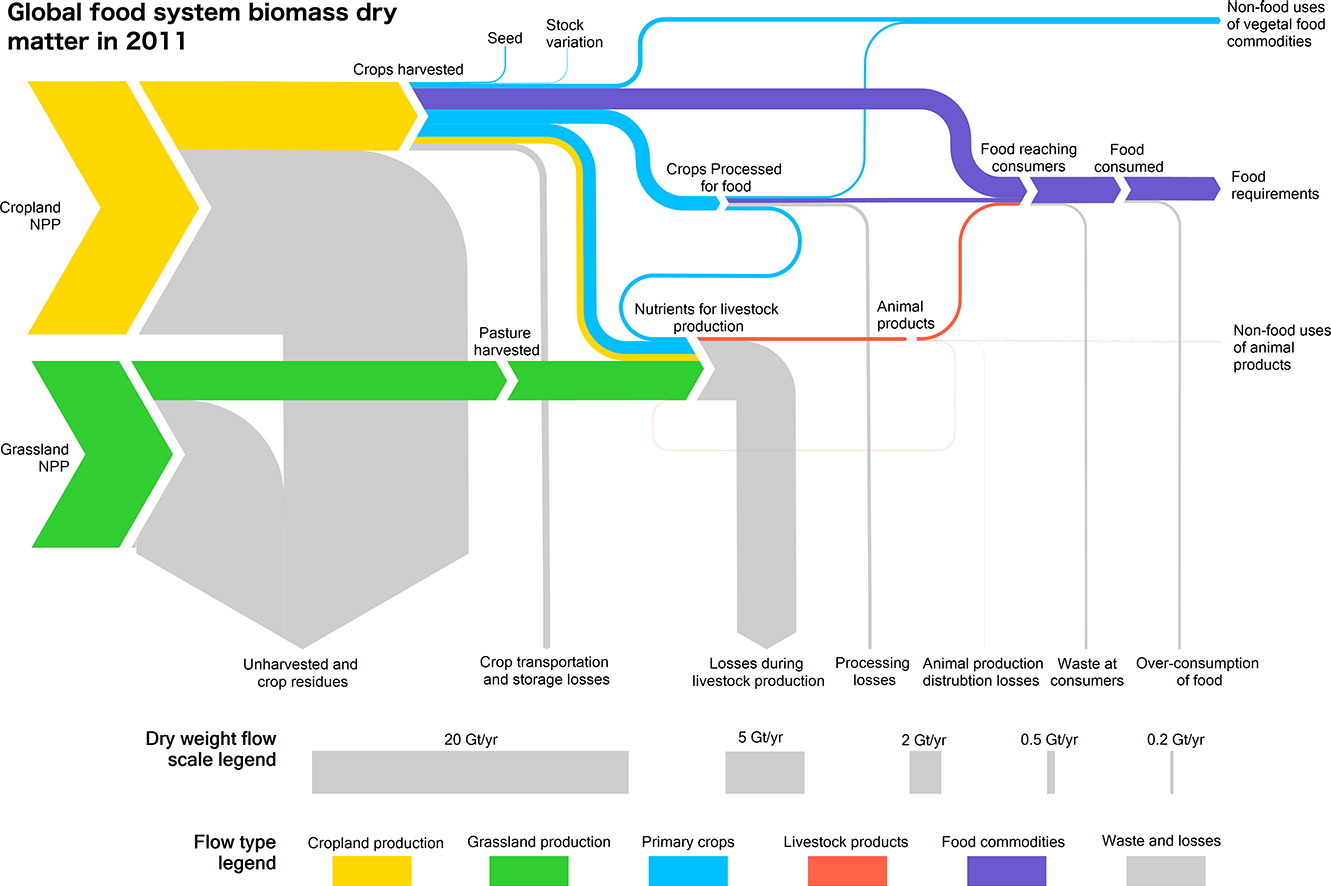
Figure 3: Food waste losses in the global food system (Alexander et al. (2017))
Alexander et al. find that only about 6% of the agricultural biomass we produce is ultimately consumed as food, with the rest being lost primarily to waste. Most of these losses occur before or during harvest, and livestock production is particularly inefficient within the food system. Consumer-level waste is a smaller contributor, but interestingly, overconsumption of food is roughly equivalent to the amount wasted by consumers (Figure 3). Taken together, these findings suggest that there is significant potential to increase the amount of food reaching consumers, especially if food prices were to spike suddenly.
Conclusion
In summary, humanity has only limited food reserves. If global food production were to suddenly stop, we would deplete our stocks in less than a year, even if the disruption occurred at the peak of our annual reserves. Even Oceania, which currently appears to have the largest stocks, would exhaust them within three years. While reducing food waste and overconsumption offers some flexibility, it’s likely insufficient to significantly extend our food supply. Moreover, in a catastrophic scenario, distributing food to where it’s needed could become a major challenge. This underscores the critical need for a backup plan to sustain the food system in the event of a significant global production shortfall.
Endnotes
(1) The US department of agriculture also publishes food stocks data, which indicates that the paper of Do et al. was done at a low point in stocks and that the wheat stocks have increased since then. Also, this number assumes that consumption stays at current level, which would probably not be true if a large catastrophe happens.
(2) One major player when it comes to stocks is China, but they are quite secretive when it comes to the actual amounts they have.
(3) Their model should be taken with a grain of salt, as it does not consider prices, which are quite important in such a scenario.
How to cite
Jehn, F. U. (2024, September 2). How much food is there?. Existential Crunch. https://doi.org/10.59350/kjx6b-n3h33
References
- Alexander, P., Brown, C., Arneth, A., Finnigan, J., Moran, D., & Rounsevell, M. D. A. (2017). Losses, inefficiencies and waste in the global food system. Agricultural Systems, 153, 190–200. https://doi.org/10.1016/j.agsy.2017.01.014
- Denkenberger, D., & Pearce, J. (2015). Feeding everyone no matter what: Managing food security after global catastrophe. Academic Press.
- Do, T., Anderson, K., & Brorsen, B. W. (2010). The World’s wheat supply. Oklahoma Cooperative Extension Service.
- Jagtap, S., Trollman, H., Trollman, F., Garcia-Garcia, G., Parra-López, C., Duong, L., Martindale, W., Munekata, P. E. S., Lorenzo, J. M., Hdaifeh, A., Hassoun, A., Salonitis, K., & Afy-Shararah, M. (2022). The Russia-Ukraine Conflict: Its Implications for the Global Food Supply Chains. Foods, 11(14), 2098. https://doi.org/10.3390/foods11142098
- Laio, F., Ridolfi, L., & D’Odorico, P. (2016). The past and future of food stocks. Environmental Research Letters, 11(3), 035010. https://doi.org/10.1088/1748-9326/11/3/035010
- Marchand, P., Carr, J. A., Dell’Angelo, J., Fader, M., Gephart, J. A., Kummu, M., Magliocca, N. R., Porkka, M., Puma, M. J., Ratajczak, Z., Rulli, M. C., Seekell, D. A., Suweis, S., Tavoni, A., & D’Odorico, P. (2016). Reserves and trade jointly determine exposure to food supply shocks. Environmental Research Letters, 11(9), 095009. https://doi.org/10.1088/1748-9326/11/9/095009